
Once there is an accurate demand forecast and a correctly calculated carrying capacity, the next step is to design visitor flow plan of the site and plan the necessary resource levels according to the amount of people who will visit the site. Resource levels are generally employees and items that are essential to the running of the site: this can range from ticket-sellers, guides (if applicable), seats and ticket booths. What is especially important to keep in mind during this process is that certain resource levels and capacities may not easily be changed or may incur high costs if changed; this may be the case for sites with theaters, parking facilities and ticketing booths. But which arrival volume number should be used for the design of the facilities and day-to-day operations? Designing for peak days may increase costs but designing for an average day may result in insufficient capacity for a large number of days during the year.

To cope with this difficulty, effective organizations build their facilities and plan their resources for a “Design Day;” a Design Day is simply defined as a “day” that balances both costs (of capacity changes) and the corresponding acceptable level of services. More importantly, the design day’s volume of visitors corresponds to the number of visitors that visit the site on 85% to 98% of the days. To better illustrate the concept, let’s look at an example.
A city landmark records daily the number of visitors who visit the site. Additionally, this site has been recording this information for the past 4 years. Now the site is looking to install new high-speed elevators; a certain number of high-speed elevators will go straight to the observation decks while the rest will serve the other floors. To appropriately plan for the number of high-speed elevators needed to meet daily demand, the management must know the number of visitors the site will receive daily 95% of the days it is open. In order to determine the site’s Design Day, the following steps should be taken:
1. Normalize multiple-year data by adjusting past years’ attendance figures by an annual rate of increase if there is an upward trend in the data (i.e. increasing attendance over the years). Alternatively, one can use only the last year’s data, especially if there is no significant increase in attendance over the years. For simplicity, we use one year of data in the numerical example in Figure 1.
2. Sort the data in increasing order of attendance.
3. Choose the attendance volume which covers 95% of the data points.
Figure 1 below visually illustrates this process.
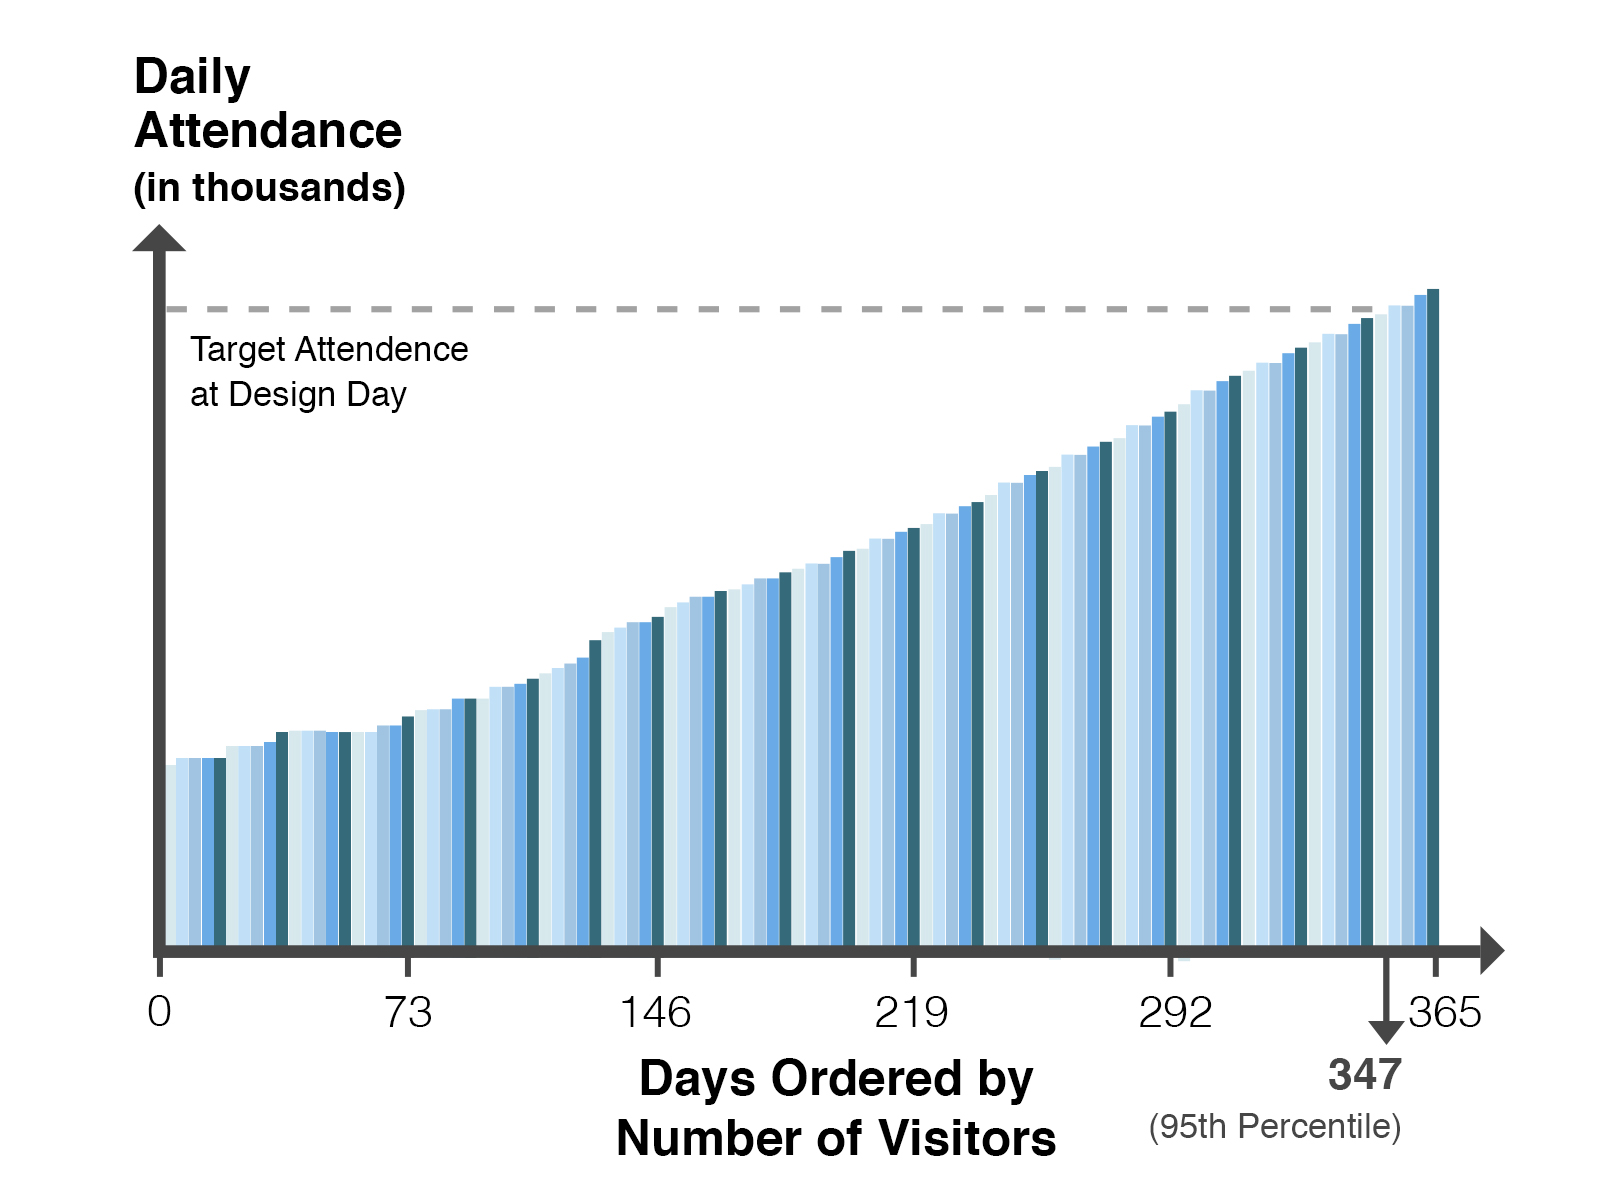
Figure 1: Daily attendance from least to greatest amount of visitors
When visitor flow and elevator operations are designed and built according to this design day, the site will able to handle 95% of the days of the year without problems. But how about the remaining days during the year when visitor numbers exceed this Design Day? Going back to our example in Figure 1, one can see there are 18 days a year that the attendance volume will exceed the Design Day’s projected volume. These days are called “Peak Days,” and it is important for sites to develop strategies to deal with these higher-visitor-volume days. The following suggestions are the most efficient ways to handle visitor demand during Peak Days:
1. Reservation Systems
By utilizing a reservation system, an organization can plan the daily and hourly maximum arrivals and move the demand to less busy periods. A reservation system can also move local visitors to non-busy days. For sites with set capacity constraints, having a mandatory reservation system for tickets should be considered. Today, most reservation systems can be done online, along with additional information and resources for visitors to optimize their visit and maximize their enjoyment.
2. Pricing and Promotions
Pricing and promotions can be used in a multitude of ways. For example, demand-based pricing (i.e. providing price incentives for low demand periods) can move visitors to “low” demand hours and can help smooth-out demand. Similarly, promotions for non-peak seasons targeting residents could be used to smooth out demand. If the site contains multiple “venues”, promoting low-demand venues could also balance the visitor load between the multiple venues at the site. Additional fees for specific parts of the site may also help to reduce casual or repeat visitor traffic into “must-see” areas.
3. Different Peak vs. Non-peak Modes of Operation
Visitor demand on peak days can also be mitigated through deploying mobile, versatile additional resources, such as ticketing agents placed at strategic points in queue areas with tablet devices or simply hiring more part-time personnel. In addition, visitors’ decisions on what day or time to visit can be influenced by informing visitors about peak days and possible limited/restricted access at different parts of venues during such days.
4. Optimization of “Hours of Operation”
Generally, many venues, and the shops and cafes housed inside them, are open during “regular business hours”, which may be good for commercial businesses but not necessarily for visitors’ convenience. By optimally extending the hours of operations for peak days, a site could spread out visitor arrivals and hence could substantially ease congestion. Another factor to consider is employee scheduling, which could have significant cost and capacity consequences. Timing resources (i.e. employees) in a staggered way could help adjust the capacity at different parts of the venue. For example, is it necessary to open the cafe at the same time as the gates open? How about the gift shop, coat check, etc.? Adjusting the hours of operation and/or varying the resource requirements could further ease the congestion caused by limited resources and reduce staffing costs simultaneously.
These strategies make up an important part of a site’s Peak Day management plan, and should be seamlessly integrated with the Design Day, which is easiest through simulation. Another reason to use simulation for these processes is for another common site problem: a lack of attendance figures and/or extreme difficulty in collecting this data. Through using a statistically sound forecasting model, one can use data gathered either through observation on a limited number of days or by using correlated attendance figures from similar venues in the area or by other strongly correlated data, to find both a Design Day and estimate Peak Day visitor volumes.
Through integrating the Design Day and Peak Day strategies into site management, it is much easier to meet visitor expectations for any day of the year. But what about exceeding visitor expectations? Tune in next time to read about the importance of visitor centers and an in-depth look at queue management.
Stay up to date KCG’s blogs here and to learn about carrying capacity and carrying plans check out our previous blog.
If you or anyone you know is interested in learning more about these techniques and how to implement them, please contact us via LinkedIn or our website.